
The Feynman-Tufte Principle
A visual display of data should be simple enough to fit on the side of a van
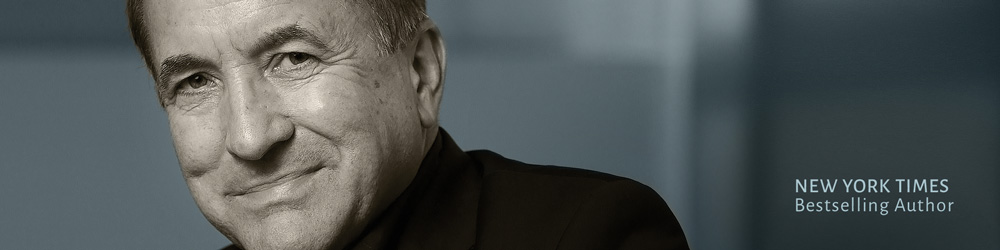
I had long wanted to meet Edward R. Tufte — the man the New York Times called “the da Vinci of data” because of his concisely written and artfully illustrated books on the visual display of data — and invite him to speak at the Skeptics Society science lecture series that I host at the California Institute of Technology. Tufte is one of the world’s leading experts on a core tool of skepticism: how to see through information obfuscation.
But how could we afford someone of his stature? “My honorarium,” he told me, “is to see Feynman’s van.”
Richard Feynman, the late Caltech physicist, is famous for working on the atomic bomb, winning a Nobel Prize in Physics, cracking safes, playing drums and driving a 1975 Dodge Maxivan adorned with squiggly lines on the side panels. Most people who saw it gazed in puzzlement, but once in a while someone would ask the driver why he had Feynman diagrams all over his van, only to be told, “Because I’m Richard Feynman!”
Feynman diagrams are simplified visual representations of the very complex world of quantum electrodynamics (QED), in which particles of light called photons are depicted by wavy lines, negatively charged electrons are depicted by straight or curved nonwavy lines, and line junctions show electrons emitting or absorbing a photon. In the diagram on the back door of the van, seen in the photograph above with Tufte, time flows from bottom to top. The pair of electrons (the straight lines) are moving toward each other. When the left-hand electron emits a photon (wavy-line junction), that negatively charged particle is deflected outward left; the right-hand electron reabsorbs the photon, causing it to deflect outward right.
Feynman diagrams are the embodiment of what Tufte teaches about analytical design: “Good displays of data help to reveal knowledge relevant to understanding mechanism, process and dynamics, cause and effect.” We see the unthinkable and think the unseeable. “Visual representations of evidence should be governed by principles of reasoning about quantitative evidence. Clear and precise seeing becomes as one with clear and precise thinking.”
The master of clear and precise thinking meets the master of clear and precise seeing in what I call the Feynman-Tufte Principle: a visual display of data should be simple enough to fit on the side of a van.
As Tufte poignantly demonstrated in his analysis of the space shuttle Challenger disaster, despite the 13 charts prepared for NASA by Thiokol (the makers of the solid-rocket booster that blew up), they failed to communicate the link between cool temperature and O-ring damage on earlier flights. The loss of the Columbia, Tufte believes, was directly related to “a PowerPoint festival of bureaucratic hyperrationalism” in which a single slide contained six different levels of hierarchy (chapters and subheads), thereby obfuscating the conclusion that damage to the left wing might have been significant. In his 1970 classic work The Feynman Lectures on Physics, Feynman covered all of physics — from celestial mechanics to quantum electrodynamics — with only two levels of hierarchy.
Tufte codified the design process into six principles: “(1) documenting the sources and characteristics of the data, (2) insistently enforcing appropriate comparisons, (3) demonstrating mechanisms of cause and effect, (4) expressing those mechanisms quantitatively, (5) recognizing the inherently multivariate nature of analytic problems, (6) inspecting and evaluating alternative explanations.” In brief, “information displays should be documentary, comparative, causal and explanatory, quantified, multivariate, exploratory, skeptical.”
Skeptical. How fitting for this column, opus 50 for me, because when I asked Tufte to summarize the goal of his work, he said, “Simple design, intense content.” Because we all need a mark at which to aim (one meaning of “skeptic”), “simple design, intense content” is a sound objective for this series.